Growth Strategy
Customer lifetime value: build a worksheet you can defend
Calculate customer lifetime value with clear revenue, margin and time assumptions. Includes an observed-cohort worksheet, fictional example and acquisition checks.
Vladlens Kecko · · 6 min read
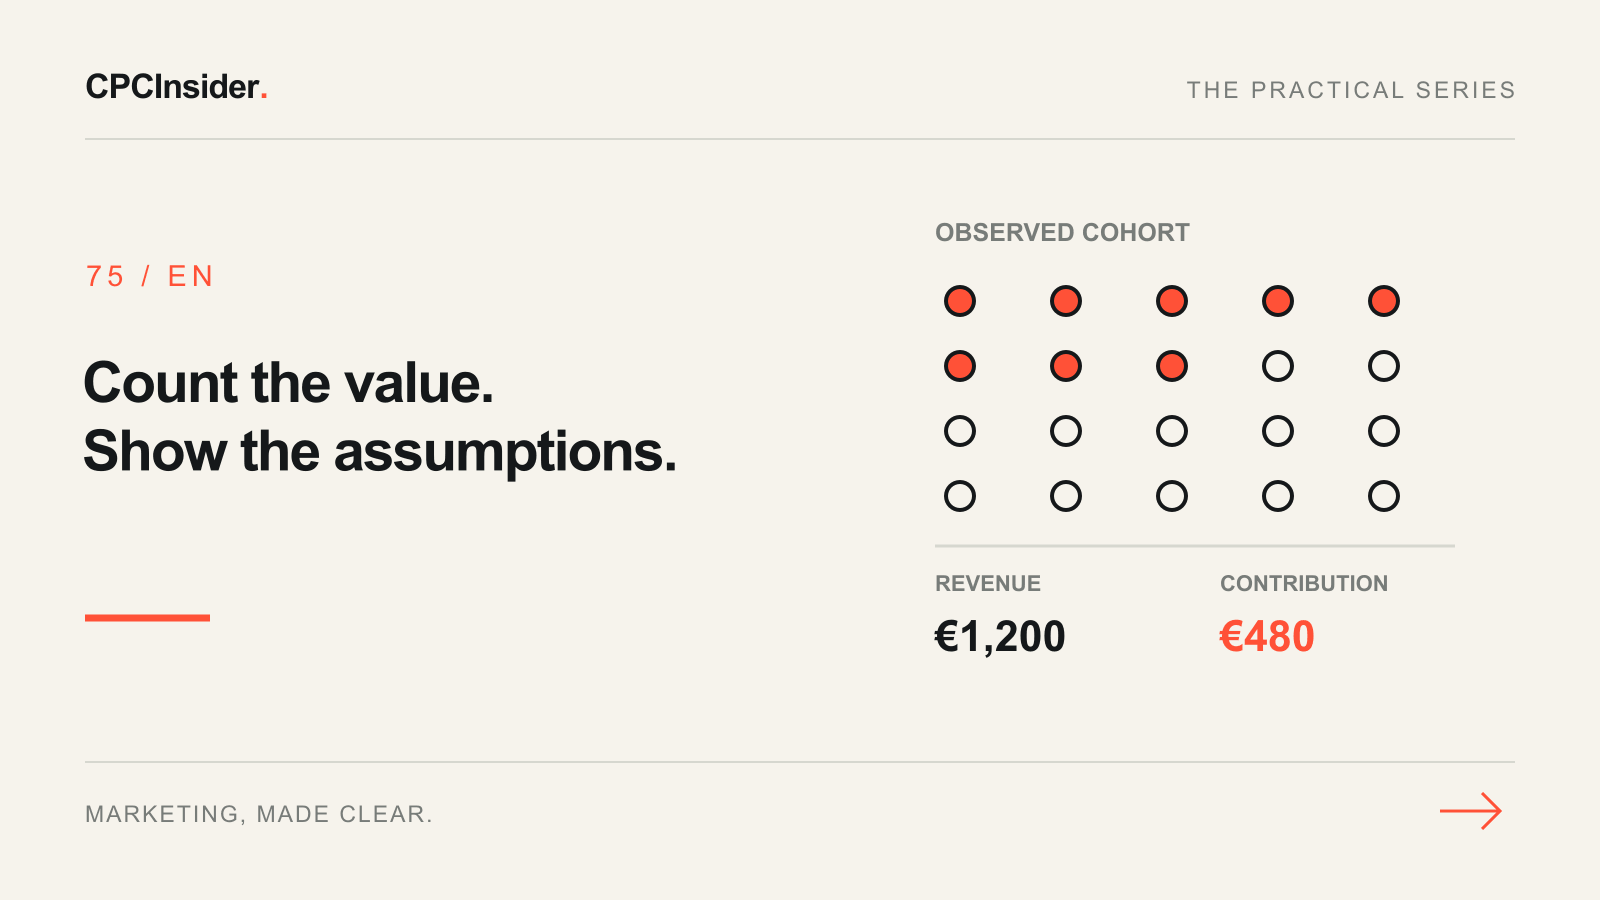
Customer lifetime value (CLV) looks at a customer's value over the relationship, rather than a single order. Before calculating it, say whether you mean revenue or contribution and whether the result is observed or predicted. Those labels change how safely the number can guide acquisition spending.
IBM distinguishes historical and predictive CLV. Start with what your records can support. A new business with six months of data should not present an assumed five-year relationship as a measured outcome.
1. Write the measurement contract
Specify the customer identifier, acquisition cohort, observation end date, currency, revenue basis, refunds and cost treatment. Use one customer identity across repeat orders where records support it. Exclude test orders and duplicates; do not upload personal information to an advertising platform as part of this spreadsheet exercise.
Choose an equal observation horizon, such as the first 12 months after acquisition. Recent customers who have not reached it are immature, not zero-value failures. Report them separately or use a shorter common horizon. A fixed-horizon value is useful, but it is not a completed lifetime value when relationships continue.
2. Calculate observed value before forecasting
Our fictional worksheet has 20 customers acquired in the same quarter. Each has completed 12 months of observation. Their net revenue, after recorded discounts and refunds and excluding VAT, totals €24,000. Variable delivery costs total €14,400.
| Measure | Fictional calculation | Result |
|---|---|---|
| Observed 12-month revenue per acquired customer | €24,000 / 20 | €1,200 |
| Observed contribution before acquisition and fixed overhead | (€24,000 − €14,400) / 20 | €480 |
| Acquisition cost per new customer | €4,000 / 20 | €200 |
| Contribution after acquisition, before fixed overhead | €480 − €200 | €280 |
Keep all 20 acquired customers in the denominator, including those who never returned. Dividing only by repeat purchasers would answer a different question. The €280 is not net profit and does not establish incremental advertising return. Costs and customer attribution must cover the same cohort and scope; the CPC, CPA and CAC guide explains the acquisition distinction.
3. Label a simple lifetime estimate honestly
Shopify's revenue formula multiplies average order value, purchase frequency and customer lifespan. Match the time units. As a separate fictional scenario, €250 × 4 purchases per year × 3 years = €3,000 estimated lifetime revenue.
The three-year duration is an assumption unless validated by relevant history. At an assumed constant 40% contribution margin, the scenario gives €1,200 before acquisition and fixed overhead. That multiplication is a simplified planning scenario, not a discounted cash-flow model or a statistical prediction. It assumes the purchasing pattern and margin persist.
Test a shorter relationship and lower margin before committing cash. In this example, two years at 30% gives €250 × 4 × 2 × 0.30 = €600. The difference is enough to change a spending decision without any change in click cost. Neither scenario is a forecast of your results.
4. Keep retention and value separate
The customer retention formula counts retained customers; it does not tell you their spending or delivery cost. Two cohorts with the same retention rate can have different contribution. Avoid substituting one period's retention percentage into a lifetime formula without a model appropriate to the business.
Segment only where definitions and samples remain useful. A tiny high-value group may be dominated by one unusually large buyer. Show customer count and the largest customer's share alongside the average before deciding it is a better acquisition audience.
5. Turn the result into a bounded decision
Choose one action the evidence can support: verify refunds, repair customer matching or review a cohort with high revenue but costly support. The retention improvement guide helps turn an observed service problem into a concrete action.
Do not spend up to the full estimated CLV. Allow for overhead, uncertainty, desired profit, payment timing and the cash needed to deliver the work. A positive lifetime scenario can still be unaffordable if acquisition is paid now and the value arrives years later. Use approved finance records to review payback timing.
Worksheet checks before sharing
- Revenue and contribution are labelled separately.
- Observed horizon and predicted lifetime are not mixed.
- Cohorts have equal maturity and a stated customer count.
- Refunds, duplicates, currency and tax treatment are consistent.
- CAC uses matching customers and a clear cost scope.
- Assumptions and sensitivity scenarios are visible.
- The decision owner understands that an estimate is not guaranteed future cash.
Find the next decision for your business
Our business growth service connects customer economics with acquisition and delivery. Book a free 30-minute founder-led growth review for a short written plan with three priorities. There is no obligation to hire CPCInsider; implementation is agreed separately.
About the author
Free founder-led growth review
Know where to focus your next marketing investment.
In a focused 30-minute conversation, we review your advertising, website and sales follow-up together. Afterwards, you receive a short written action plan you can use with your own team or with ours.
Your biggest growth gaps
See where your ads, website or follow-up may be losing potential customers.
Your next 3 priorities
Get a ranked action list with the reason for each recommendation and what to check next.
A practical starting plan
Leave with clear next steps for your team, plus our recommendation if you want help implementing them.
Continue reading
Customer retention rate formula: calculate it correctly in a spreadsheet
Calculate customer retention rate with worked examples and spreadsheet formulas. Check new-customer counts, opening cohorts and common reporting mistakes.
CPC vs CAC: why cheaper clicks can cost you more customers
Compare CPC, CPA and CAC with clear formulas and two campaign examples. Use the free worksheet to see whether cheaper clicks really lower customer costs.
Customer retention rate: turn the number into one practical improvement
Use customer retention rate to identify where customers leave, investigate the reasons and plan one measurable improvement with clear ownership.